A new Cambridge University study placed Ethereum near the lower end of energy intensity among major proof-of-stake (PoS) blockchains, although the network still used more electricity overall than most of the PoS networks studied.
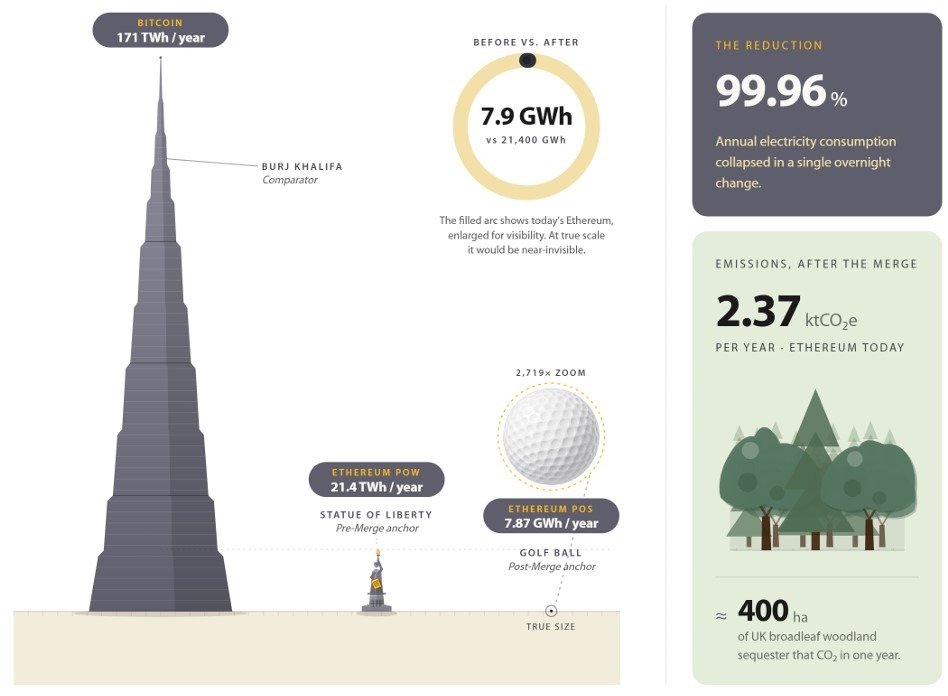
The Cambridge Centre for Alternative Finance estimated that activity on Ethereum consumes about 7.87 gigawatt-hours (GWh) of electricity annually. When adjusted for market value, the network used roughly 33 kilowatt-hours (kWh) per $1 million of market value, the second-lowest figure among the proof-of-stake networks assessed, behind BNB Chain.
Solana used the most electricity, at about 13.48 GWh per year. Its energy intensity was roughly 283 kWh per $1 million, around 8.5 times Ethereum’s, while the networks in the comparison consumed about 38 GWh combined.
The report provides one of the most detailed assessments yet of Ethereum’s post-merge footprint, giving policymakers and investors a more current basis for comparing blockchain sustainability. The September 2022 merge, when the network transitione from a proof-of-work (PoW) consensus mechanism to PoS, reduced Ethereum’s energy consumption by approximately 99.96%.
Illustration of post-merge Ethereum consumption. Source: Cambridge
The merge replaced miners competing with one another using energy-intensive computing equipment with validators who secure the network by staking Ether.
Related: Vitalik Buterin shares priorities for new ‘Lean Ethereum’ strawmap
New estimates map Ethereum’s energy use
Cambridge measured how much electricity Ethereum nodes used at the point of connection across 20 combinations of the network’s main software clients. It found that a typical home setup used about 18 watts, while a more powerful workstation used roughly 153 watts.
Using Ethereum’s mix of residential and professionally hosted nodes, the researchers estimated an average power draw of about 105 watts per node. Cambridge counted around 8,522 discoverable full nodes, with 64% running in cloud or enterprise facilities and 36% on residential connections.
Cambridge said Ethereum’s remaining emissions are now driven mainly by the electricity grids supplying its nodes. The study estimated that about 56.4% of the network’s electricity mix came from renewable and nuclear sources, compared with 43.6% from fossil fuels.
Magazine: Bitcoin nearing late stages of bear market: Jamie Coutts, Real Vision